


Choosing to invest in long-term dividend stocks means selecting companies with a strong track record of dividend payments, robust cash flow, and sustainable growth. These companies often prioritize financial health and stability, rewarding shareholders through regular income and attractive yield metrics. By focusing on essential indicators like a dividend payment streak exceeding ten years, consistent free cash flow growth, and a favorable P/E ratio, investors can identify dividend stocks that not only offer reliable payouts but also long-term value appreciation. This approach provides a balanced investment option, blending income with growth potential.
Methodology: How Did We Choose These Stocks?
To identify the most promising long-term dividend stocks, we applied a rigorous selection process using a set of key financial metrics designed to pinpoint companies with stable income potential and sustainable growth. Here are the metrics we used:
Dividends Payment Streak: We considered only companies with a history of paying dividends for over ten consecutive years, reflecting a commitment to returning capital to shareholders.
Unlevered Free Cash Flow Growth: By focusing on companies with over 10% growth in unlevered free cash flow, we ensured they have a solid financial foundation to support ongoing dividend payments.
Dividend Yield: A minimum yield of 3% was required, which offers investors an attractive income stream relative to other asset classes.
P/E Ratio: To avoid overvalued stocks, we filtered for those with a price-to-earnings ratio between 10 and 30, indicating fair valuation based on current earnings.
Market Capitalization: Only companies with a market cap above $1 billion were included, as larger firms typically have more stable cash flows and are less volatile.
Dividend CAGR (5-Year): We looked for companies with a five-year dividend compound annual growth rate (CAGR) of over 10%, signaling a trend of increasing dividends over time.
Shareholder Yield: Finally, we prioritized stocks with a shareholder yield above 10%, indicating strong returns through dividends and share buybacks.
By combining these metrics, we were able to identify dividend stocks that not only meet high standards for financial health and reliability but also align with a long-term income-focused investment strategy.

Best Long-Term Dividend Stocks
| Company Name | Symbol | Dividends Payment Streak | P/E Ratio | Market Cap |
| AXA SA | CS | 47 | 11.1x | 93.219 B |
| Koninklijke Ahold Delhaize NV | AD | 20 | 15.8x | 40.977 B |
| WH Group Ltd | 288 | 11 | 10.7x | 16.795 B |
| Sichuan Road & Bridge Group Co Ltd | 600039 | 14 | 11.3x | 12.691 B |
| Aegon Ltd | AGN | 15 | 10.0x | 10.888 B |
| Dangote Cement PLC | DANGCEM | 17 | 13.5x | 9.815 B |
| Zhejiang Longsheng Group Co Ltd | 600352 | 17 | 20.4x | 6.136 B |
| Bosideng International Holdings Ltd | 3998 | 18 | 11.5x | 5.932 B |
1. AXA SA (CS)
Industry: Financials
Market: France
Dividends Payment Streak: 47
P/E Ratio: 11.1x
Market Cap: 93.219 B
AXA SA, through its subsidiaries, insurance, asset management, and banking services worldwide. The company operates through France, Europe, AXA XL, Asia, Africa & EME-LATAM, and Transversal & Other segments. It offers life and savings insurance and property and casualty insurance products. The company also provides protection and retirement products for individual and professional customers. AXA SA was founded in 1852 and is headquartered in Paris, France.
Industry: Consumer Staples
Market: Netherlands
Dividends Payment Streak: 20
P/E Ratio: 15.8x
Market Cap: 40.977 B
Koninklijke Ahold Delhaize N.V. operates retail food stores and e-commerce in the Netherlands, the United States, and internationally. The company’s stores offer produce, dairy, meat, deli, bakery, seafood, and frozen products; grocery, beer, and wine, among others. The company was formerly known as Koninklijke Ahold N.V. and changed its name to Koninklijke Ahold Delhaize N.V. in July 2016. The company was founded in 1867 and is headquartered in Zaandam, the Netherlands.
Industry: Consumer Staples
Market: Hong Kong
Dividends Payment Streak: 11
P/E Ratio: 10.7x
Market Cap: 16.795 B
WH Group Limited, an investment holding company, produces and sells packaged meats and pork in China, North America, and Europe. It operates through Packaged Meats, Pork, and Others segments. The company is involved in production, wholesale, and retail sale of low temperature and high temperature meat products. It also engages in the operation of finance and property development companies, and a chain of retail food stores; and livestock breeding. WH Group Limited was founded in 1958 and is headquartered in Kowloon, Hong Kong.
Industry: Industrials
Market: China
Dividends Payment Streak: 14
P/E Ratio: 11.3x
Market Cap: 12.691 B
Sichuan Road & Bridge Group Co.,Ltd engages in the investment, development, construction, and operation of engineering construction, clean energy, and mining and new materials in China and internationally. The company is involved in bridge engineering, highway engineering, tunnel engineering, railway engineering, municipal affairs, housing construction, and urban development, port and shipping, water conservancy, and hydropower projects, and low-carbon intelligent projects. It also engages in clean energy and mining and new minerals.
Industry: Financials
Market: Netherlands
Dividends Payment Streak: 15
P/E Ratio: 10.0x
Market Cap: 10.888 B
Aegon Ltd. Engages in the provision of insurance, pensions, retirement, and asset management services in the Americas, the Netherlands, the United Kingdom, and internationally. It operates through three segments: Distribution, Protection Solutions, and Savings & Investments. The company offers retirement plans, mutual funds, and stable value solutions; and annuities, individual life, life and health, and individual health.
Industry: Materials
Market: Nigeria
Dividends Payment Streak: 17
P/E Ratio: 13.5x
Market Cap: 9.815 B
Dangote Cement Plc, together with its subsidiaries, engages in the preparation, manufacturing, distribution, and sale of cement and related products in Nigeria. The company was formerly known as Obajana Cement Plc and changed its name to Dangote Cement Plc in July 2010. The company was founded in 1981 and is headquartered in Lagos, Nigeria. Dangote Cement Plc operates as a subsidiary of Dangote Industries Limited.
Industry: Materials
Market: China
Dividends Payment Streak: 17
P/E Ratio: 20.4x
Market Cap: 6.136 B
Zhejiang Longsheng Group Co.,Ltd. engages in the research and development, production, and sales of chemical products. The company offers dyes, intermediates, additives, and inorganic chemicals. It is also involved in the production and sales of auto parts; and engages in the real estate development business. The company was founded in 1970 and is headquartered in Shaoxing, the People’s Republic of China.
Industry: Consumer Discretionary
Market: Hong Kong
Dividends Payment Streak: 18
P/E Ratio: 11.5x
Market Cap: 5.932 B
Bosideng International Holdings Limited engages in the apparel business in the People’s Republic of China. It operates through four segments: Down Related Apparels, OEM Management, Ladieswear Apparels, and Diversified Apparels. The company distributes its products through self-operated retail and retail outlets operated by third party distributors. Bosideng International Holdings Limited was founded in 1976 and is based in Central, Hong Kong.
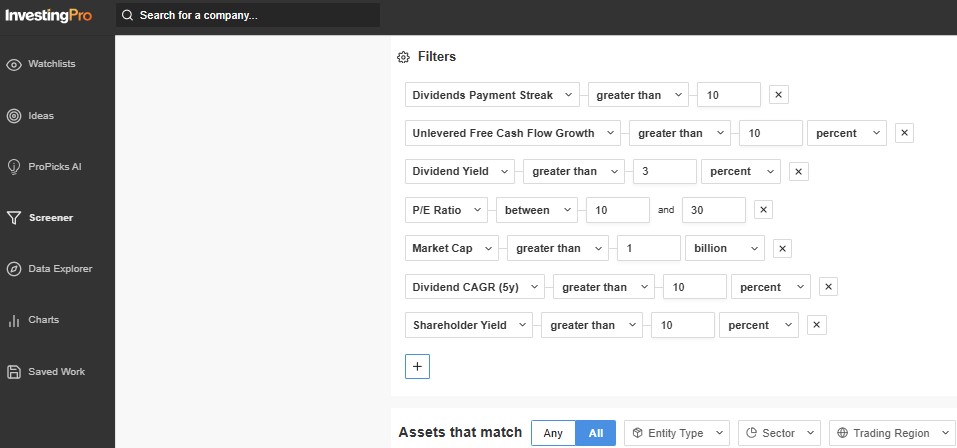
How to Find Long-Term Dividend Stocks
Investors can find long-term dividend stock opportunities easily using the advanced InvestingPro stock screener. Here are the steps:
Click on the Screener Tool.
- Navigate to the stock screener page to start filtering your stock options.
Set Dividend Payment Streak.
- Select the filter for “Dividends Payment Streak.”
- Set the minimum requirement to 10 years to focus on companies with a consistent history of paying dividends.
Filter by Unlevered Free Cash Flow Growth.
- Choose the “Unlevered Free Cash Flow Growth” filter.
- Set the threshold for growth to greater than 10% to ensure the company has strong financial health to support dividends.
Select Dividend Yield.
- Find the “Dividend Yield” filter.
- Adjust the settings to include only companies with a minimum yield of 3% to ensure a satisfactory income stream for investors.
Apply Price-to-Earnings Ratio.
- Locate the “P/E Ratio” filter on the screener.
- Set the range between 10 and 30 to identify stocks that are fairly valued.
Market Capitalization Filter.
- Select the “Market Cap” filter parameter.
- Set the minimum market capitalization threshold to $1 billion to focus on more stable and less volatile companies.
Add Dividend CAGR (5-Year) Criteria.
- Choose the “Dividend CAGR (5-Year)” filter.
- Set the threshold to greater than 10% to find companies with a trend of increasing dividends.
Final Filter for Shareholder Yield.
- Find the “Shareholder Yield” filter.
- Set the minimum requirement to greater than 10% to prioritize stocks providing strong returns through dividends and share buybacks.
Long-Term Dividend Stocks FAQs (Frequently Asked Questions)
1. What are long-term dividend stocks?
Long-term dividend stocks are shares in companies that have a consistent history of paying dividends to their shareholders over an extended period, typically more than ten years. These stocks are often sought for their potential to provide steady income and capital appreciation.
2. Why should I invest in long-term dividend stocks?
Investing in long-term dividend stocks can provide a reliable income stream, especially during market volatility. They often indicate financial stability and growth potential, as companies that consistently pay dividends tend to be well-managed with solid business models.
3. How do I evaluate long-term dividend stocks?
Key metrics to evaluate long-term dividend stocks include the dividend payment streak, unlevered free cash flow growth, dividend yield, P/E ratio, market capitalization, dividend CAGR (compound annual growth rate), and shareholder yield. These metrics help assess the company’s ability to sustain and grow its dividend payouts.
4. What is a good dividend yield?
A good dividend yield generally depends on market conditions and individual investment goals. However, a yield of 3% or higher is often considered attractive, as it offers a decent return compared to other asset classes.
5. What does a dividend payment streak indicate?
A dividend payment streak indicates a company’s commitment to returning capital to its shareholders. A long streak (typically over ten years) suggests that the company has maintained stable earnings and cash flows, which is crucial for sustaining dividend payments.
6. What is the significance of P/E ratio in dividend stocks?
The P/E ratio helps investors gauge whether a stock is overvalued or fairly priced based on its earnings. A P/E ratio between 10 and 30 is generally considered reasonable for dividend stocks, suggesting that investors are paying a fair price for expected earnings.
Shareholder yield encompasses both dividends paid and share buybacks, providing a comprehensive view of how much cash a company returns to its shareholders. A shareholder yield above 10% is often seen as a strong indicator of a company’s commitment to creating value for investors.
Dividend yield refers to the annual dividend payment expressed as a percentage of the stock’s current price, indicating the income generated solely from dividends. In contrast, shareholder yield includes not only dividends but also share buybacks, reflecting the total return to shareholders through both mechanisms. Thus, shareholder yield provides a broader view of how a company returns capital to its investors.
9. How often do dividend stocks pay dividends?
Most dividend stocks pay dividends quarterly, but some may pay monthly, semi-annually, or annually. It’s essential to check the specific company’s dividend policy for exact payment schedules.
🧮 Try Our Dividend Calculators Today!
Get ahead with our powerful tools:
📈 Dividend Returns Calculator – See how your investments can grow
💹 Dividend Yield Calculator – Find dividend yields easily


